
Data Envelopment Analysis (DEA)
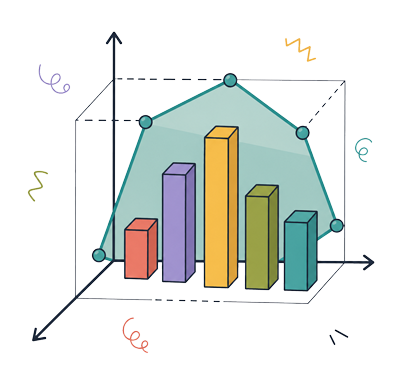
Understanding DEA
What is DEA?
Data Envelopment Analysis (DEA) is a linear programming-based technique used to measure the relative efficiency of a set of comparable units, called Decision-Making Units (DMUs), such as bank branches, hospitals, schools, or suppliers. Unlike methods that require a predefined formula linking inputs to outputs, DEA builds an efficiency frontier directly from the observed data and scores each DMU relative to that frontier.
When to Use DEA
This makes it especially useful when multiple inputs and outputs are involved and their relative importance is not known in advance — for example, when comparing the efficiency of hospital departments with different staff levels and patient outcomes, evaluating bank branches with different costs and revenues, or benchmarking suppliers with different resource use and output quality.
Why Choose DEA
Choose DEA over other efficiency-measurement methods whenever you don't want to assume a fixed weighting between inputs and outputs — DEA assigns weights to each DMU in the way most favorable to it, before scoring it fairly against the rest, making it more objective than approaches that require predefined weights or a single production formula.
Where DEA Is Applied
DEA is widely applied in banking, healthcare, education, energy, manufacturing, and public-sector performance evaluation, wherever multiple comparable units need to be ranked by efficiency using multiple inputs and outputs.
How to Calculate DEA — Step by Step
Step 1: Select Decision-Making Units (DMUs)
Identify the set of comparable units you want to evaluate — for example, branches, hospitals, suppliers, or departments — making sure they perform similar functions and are meaningfully comparable.
Step 2: Choose Inputs and Outputs
Select the resources each unit consumes (inputs, e.g., staff, cost, time) and the results each unit produces (outputs, e.g., revenue, patients treated, units sold).
Step 3: Collect the Data
Gather accurate input and output values for every DMU, ensuring the data is consistent, complete, and measured on the same basis across all units.
Step 4: Choose a DEA Model
Select the appropriate model orientation (input-oriented or output-oriented) and returns-to-scale assumption (CCR for constant returns, or BCC for variable returns), based on the nature of your DMUs.

Step 5: Formulate the Linear Programming Model
Set up the DEA linear program for each DMU, assigning weights to its inputs and outputs in the way most favorable to that unit, subject to the constraint that no DMU's efficiency score can exceed 1.
Step 6: Solve for Efficiency Scores
Solve the linear program for each DMU to obtain its efficiency score — a value of 1 means the DMU is efficient (on the frontier), while a value below 1 shows how far it falls short.
Step 7: Identify Reference Units
For each inefficient DMU, identify its "peer" or "reference" units — the efficient DMUs whose combination forms the point on the frontier that the inefficient DMU is compared against.
Step 8: Analyze Improvement Targets
Use the efficiency scores and reference units to determine the specific input reductions or output increases each inefficient DMU would need to reach the efficiency frontier.
See It in Action
Curious how DEA works? Walk through a solved example — or skip straight to analyzing your own criteria with our free online tool.
No installation required
Advantages and Limitations of DEA
| Advantages | Limitations |
| ✓ Handles multiple inputs and outputs simultaneously without requiring a predefined formula | ! Sensitive to measurement errors and outliers, since scores are relative, not absolute |
| ✓ Does not require assuming fixed weights — each DMU is scored in its most favorable light | ! Results depend heavily on the choice and number of inputs/outputs selected |
| ✓ Identifies specific improvement targets and peer/reference units for inefficient DMUs | ! Requires a sufficiently large number of DMUs relative to the number of inputs/outputs to produce meaningful discrimination |
| ✓ Works well for comparing units where no single input-output formula is known in advance | ! Efficiency scores are relative to the sample, not an absolute or universal benchmark |
How DEA Compares to Other Methods
DEA vs. AHP
DEA measures efficiency objectively from observed input-output data without requiring subjective judgments, while AHP relies on pairwise comparisons and expert opinions to derive weights — the two are often combined, with AHP restricting or informing the weights used in a DEA model.
DEA vs. TOPSIS
DEA evaluates efficiency by building a frontier from the data itself and allows each DMU to be scored in its own favor, while TOPSIS ranks alternatives by their distance from a fixed ideal and worst solution using predefined criteria weights — DEA is preferred when no single formula or weighting is known in advance, while TOPSIS is preferred when weights are already established.
DEA vs. Fuzzy DEA
Fuzzy DEA extends classical DEA by allowing inputs, outputs, or judgments to be expressed as fuzzy numbers rather than exact values — making it more suitable when data is imprecise or based on linguistic expert estimates, while classical DEA works best with crisp, reliable numerical data.
DEA Books
These are some of the most widely referenced books for understanding and applying DEA in academic research and real-world decision-making.

Fuzzy Multi-Criteria Decision Making
Overview Editors: Cengiz KahramanClassifies...

Fuzzy TOPSIS Logic, Approaches, and Case Studies
Fuzzy TOPSISLogic, Approaches, and Case Studies...
Swara FAQ
Discover the most common questions and answers...
DEA Articles
Explore academic and applied research articles that use DEA to analyze real-world decision-making problems.
Fuzzy Multi-Criteria Decision Making
Overview Editors: Cengiz KahramanClassifies...
Fuzzy TOPSIS Logic, Approaches, and Case Studies
Fuzzy TOPSISLogic, Approaches, and Case Studies...
Swara FAQ
Discover the most common questions and answers...
DEA Blog Posts
Read practical guides, tutorials, and case studies about applying DEA
Fuzzy Multi-Criteria Decision Making
Overview Editors: Cengiz KahramanClassifies...
Fuzzy TOPSIS Logic, Approaches, and Case Studies
Fuzzy TOPSISLogic, Approaches, and Case Studies...
Swara FAQ
Discover the most common questions and answers...
DEA FAQ
Answers to the most common questions about DEA
What is DEA?
Data Envelopment Analysis (DEA) is a linear programming-based method used to measure the relative efficiency of comparable units (DMUs) based on multiple inputs and outputs.
What are the main steps of DEA?
- Select the Decision-Making Units (DMUs)
- Choose the inputs and outputs
- Collect the data
- Choose a DEA model (CCR or BCC, input- or output-oriented)
- Formulate the linear programming model
- Solve for efficiency scores
- Identify reference units
- Analyze improvement targets
What does a DEA efficiency score mean?
A score of 1 means the DMU is efficient and lies on the frontier; a score below 1 shows the DMU is inefficient, with the gap indicating how much it would need to improve to become efficient.
What is the difference between the CCR and BCC models?
The CCR model assumes constant returns to scale, while the BCC model allows for variable returns to scale, making it more suitable when DMUs operate at different scales of size.
What is the difference between input-oriented and output-oriented DEA?
Input-oriented DEA looks for the maximum proportional reduction in inputs while keeping outputs fixed, while output-oriented DEA looks for the maximum proportional increase in outputs while keeping inputs fixed.
What are reference units (peers) in DEA?
They are the efficient DMUs that form the closest point on the efficiency frontier for a given inefficient DMU, serving as realistic benchmarks for improvement.
Can DEA handle qualitative or uncertain data?
Not directly — classical DEA requires precise numerical data; when data is imprecise or expressed linguistically, Fuzzy DEA is used instead.
Can I perform DEA analysis online?
Yes, you can use the DEA online software at OnlineOutput.com.
Ready to Analyze Your Own Criteria?
Skip the manual matrices and expert consensus calculations — get accurate DEA results in minutes.
No installation required