A Visual Guide to Online Fuzzy VIKOR Software
Working with fuzzy VIKOR software is straightforward: (1) Define the number of alternatives and criteria, (2) Select or create the fuzzy scale, (3) Enter the decision matrix data, and (4) Obtain the full report
1. Input the Project Name
Begin by entering your project name. In this project, the fuzzy VIKOR method is applied to select the best college.
2. Project Specifications
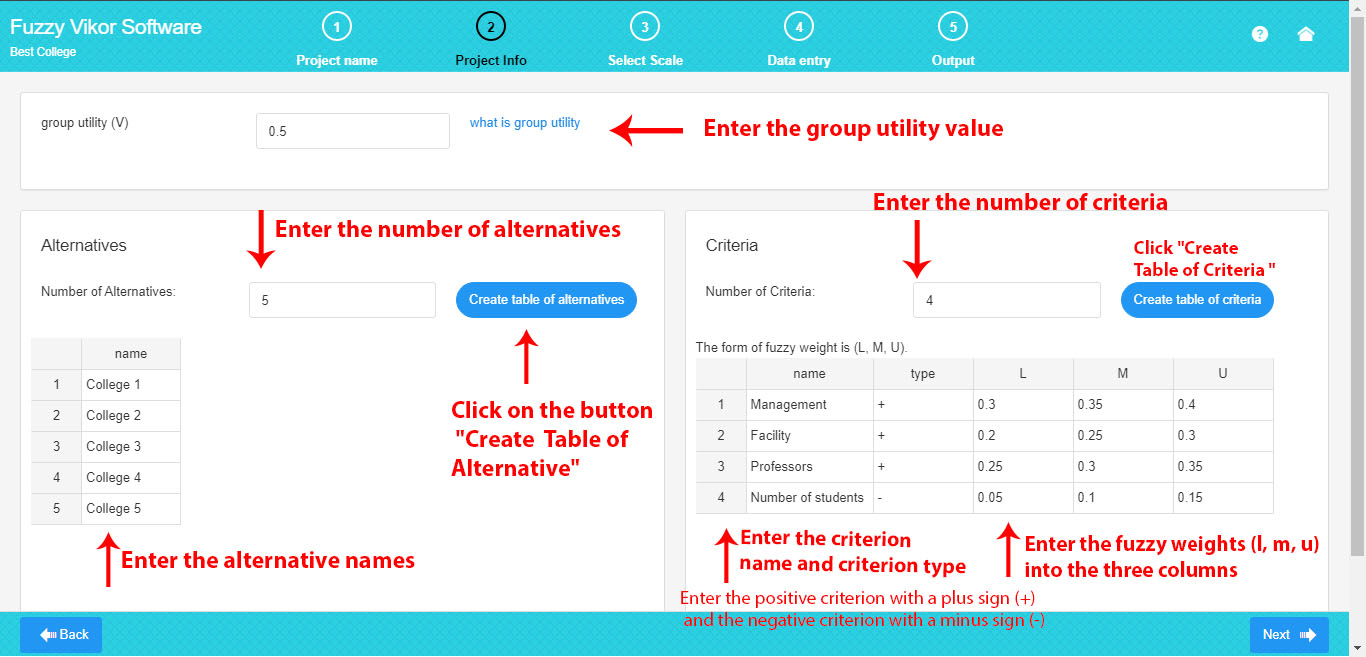
Here, you can specify the number of alternatives, the number of criteria, and the value of the group utility.
Criteria:
To assign a name to the criterion, click on its name and enter a short, preferred name.
Enter each criterion in the table column, and then click the “Create Table of Criteria” button. This action will generate a table of criterion specifications.
In the criterion table, you can input the criterion name, criterion type, and the fuzzy weight of the criterion. The criterion type can be either positive or negative, denoted by the plus sign (+) or the minus sign (-) in the criterion table. The fuzzy weights are represented as l, m, u, corresponding to lower, middle, and upper values, respectively.
Note that if the weight of your criterion is a crisp value, l, m, and u can be defined by a number. For example, if the weight of a criterion is 0.3, select (0.3, 0.3, 0.3) in the software.
Alternatives:
If you want to choose a name for the alternative in the name column, enter your desired short name.
Group Utility:
The group utility value ranges between 0 and 1, assumed to be 0.5. Click on the link “What is Group Utility” in the software to become familiar with this variable
.
3. Select /Create the Fuzzy Scale
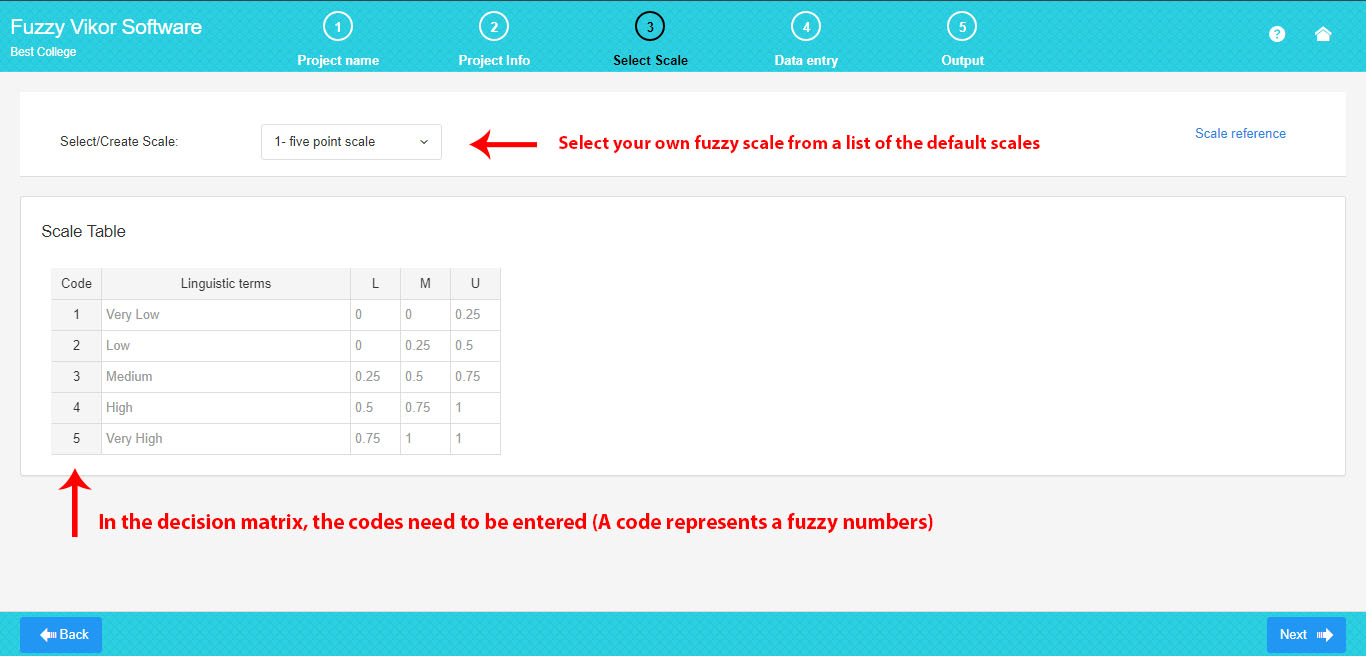
Here, you can select or create your own fuzzy scale from a list of default fuzzy scales.
You can choose your own default fuzzy scale from a drop-down list.
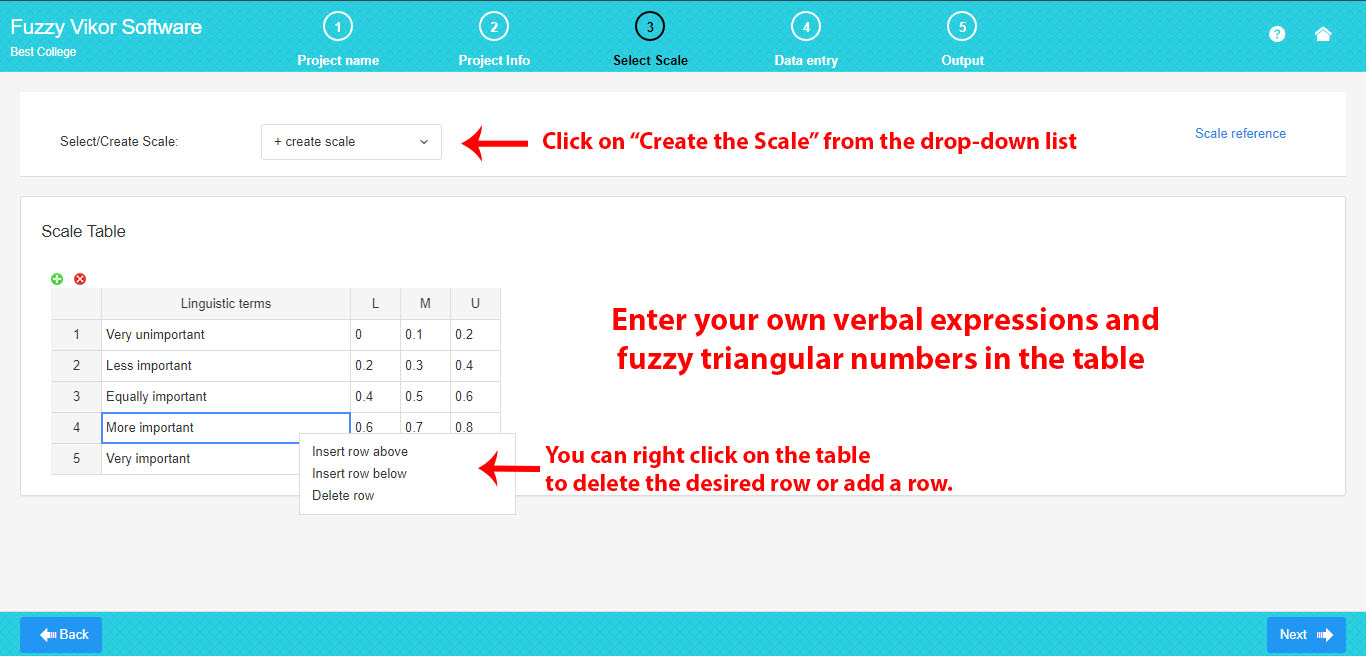
If you prefer to create your own fuzzy scale, click “Create Scale” to generate and edit your own scale in the table.
To create a new scale, enter your linguistic terms and fuzzy triangular numbers. These triangular fuzzy numbers are characterized as l, m, u, representing the lower, middle, and upper values, respectively.
As depicted in the picture, you can easily edit a scale.
4. Enter the Decision Matrix Data
Here, you can complete the decision matrix based on the number of criteria and alternatives. Criteria are arranged in columns, and alternatives are organized in rows.
In the decision matrix, it is essential to input the codes from the scale table (where each code signifies a verbal expression; for example, code 5 implies high importance).
To fill the decision matrix, simply click on each cell, and enter your assigned scale code.
It is advisable to enter codes in Excel to save time, and then copy and paste the matrix data from Excel all at once.
.
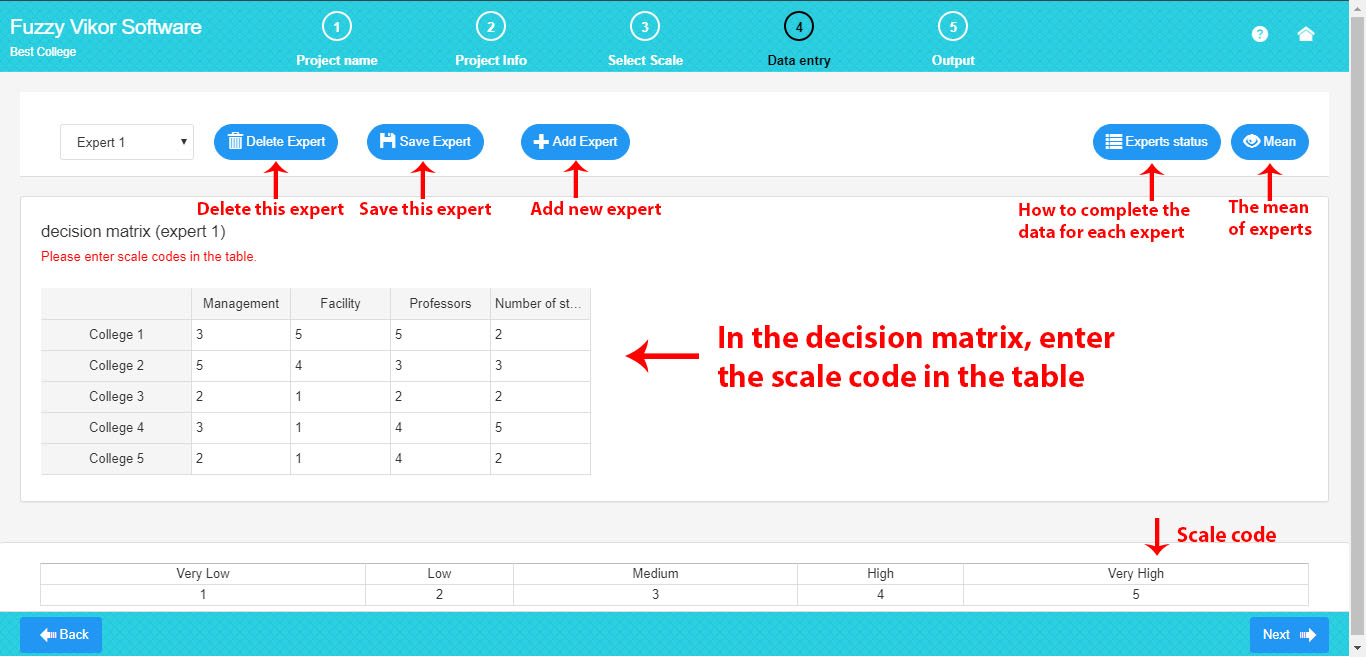
As seen in the picture above, experts include the following options:
-
Add Expert: Increase the number of experts by clicking “Add Expert” if there are several experts. The previous expert will be automatically saved, and the new expert will be added.
-
Delete Expert: Remove the current expert by clicking “Delete Expert.”
-
Save Expert: Save the data of the current expert by clicking “Save Expert.”
-
Experts’ Status: Display the status of the experts by clicking “Experts Status.”
-
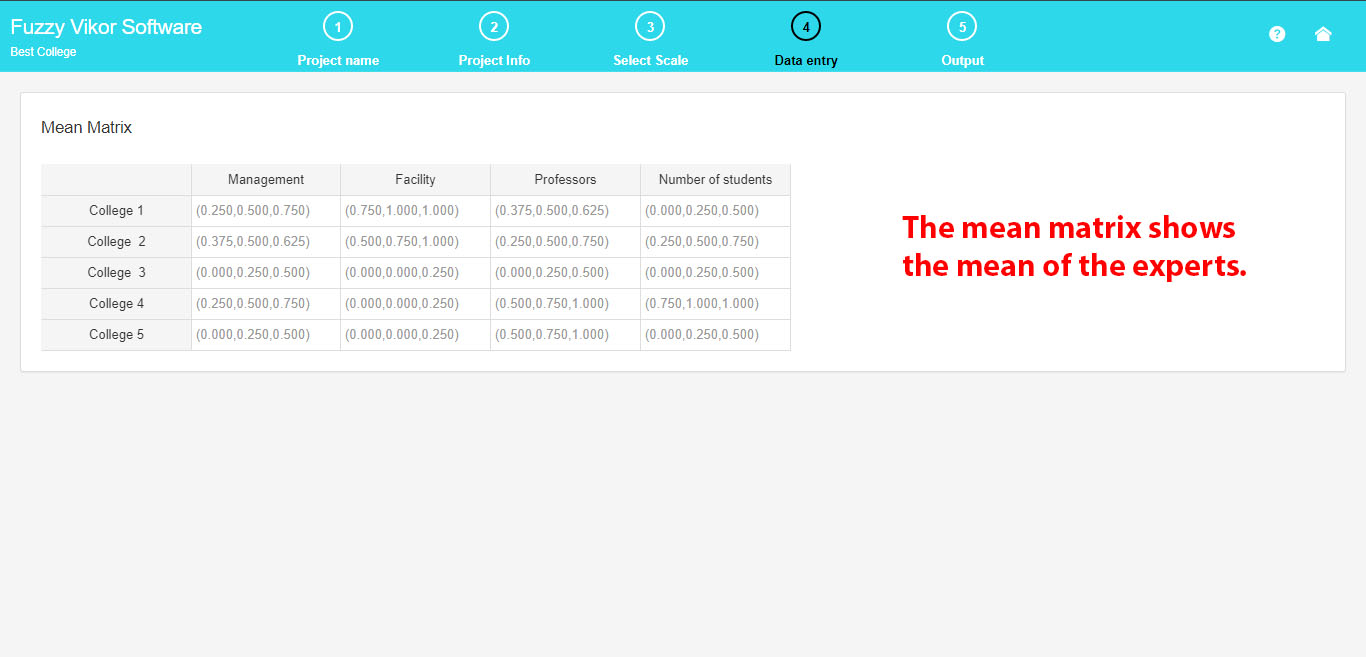
Mean: Observe the fuzzy average of all the experts by clicking “Mean.”
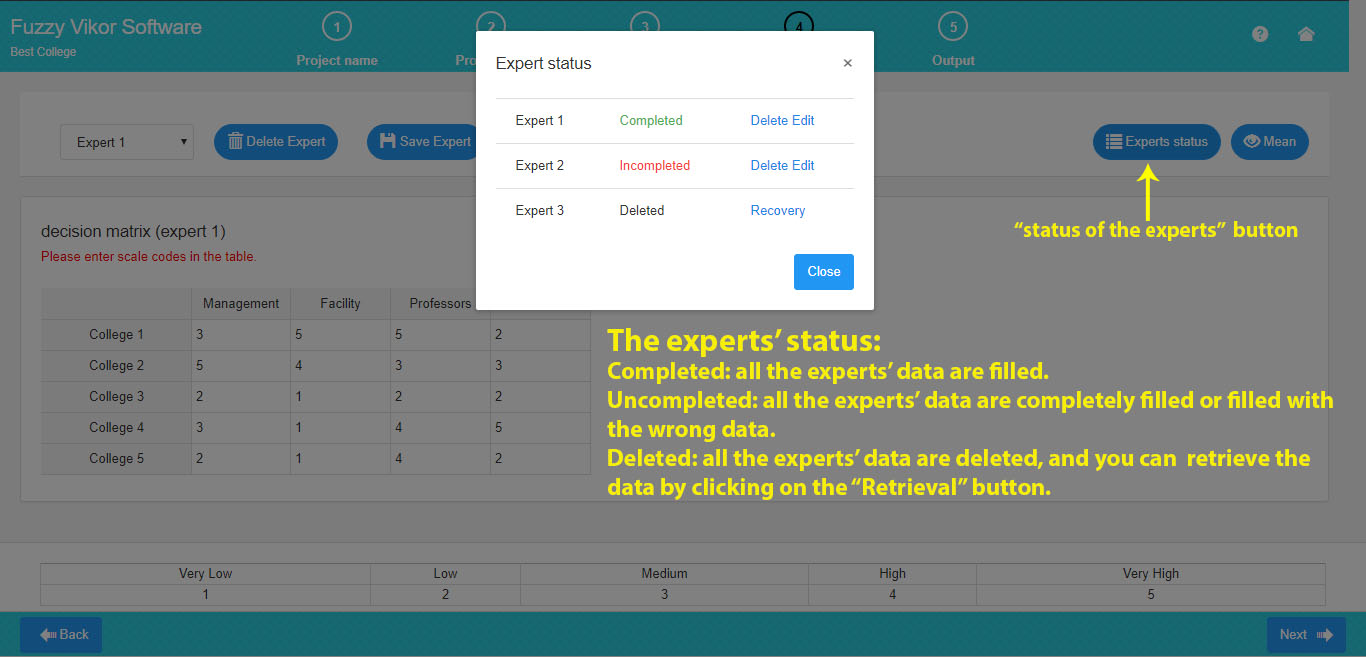
In the picture below, the experts’ status includes:
-
If all the expert data are completed and saved, the expert’s status is “completed.”
-
If all the expert data are not completed, the expert’s status is “incomplete.”
-
If an expert has been deleted, the expert’s status is “deleted,” and you can retrieve the data
To calculate the mean, ensure that the data for all current experts is completed.
5. Get a Full Report
You can obtain the complete output of the fuzzy VIKOR method. Here, you will find all the steps of the fuzzy VIKOR method along with the associated tables and formulas.

6. Download Excel and Word
Here, you can download the Word report file, Excel file, and input data.

